 OSHAidProductsDemosIndustriesPricingMoreClient accessTry OSHAidFree🇺🇸ENTry OSHAidBack to blogDataNovember 19, 2026· By the OSHAid Safety Desk
OSHA incident rate by industry: what the 2025 data shows
The Bureau of Labor Statistics released its 2025 injury and illness estimates on November 18. Private industry recorded 2.4 million cases at a rate of 2.3 per 100 full-time equivalent workers - the benchmark your own 300 Log will be read against.
Your OSHA incident rate is the number that travels. It goes on client prequalification forms, into insurance renewals, and onto the one safety slide leadership reads all year. On November 18, 2026 the Bureau of Labor Statistics published the figures yours will be measured against.
Private industry employers reported 2.4 million nonfatal workplace injuries and illnesses in 2025, down 3.0 percent from 2024, at a total recordable case rate of 2.3 cases per 100 full-time equivalent workers, according to the BLS release of November 18, 2026.
That rate is not a target OSHA sets. It is a survey estimate built from employers' own injury and illness records, and the version that matters to you is the one for your industry. Here is what the 2025 numbers say, and how to work out where you sit before the annual summary is due.
The OSHA incident rate benchmarks for 2025
The national picture. The 2.4 million total is a third consecutive annual decrease. Injuries account for 2.3 million of it, down 1.5 percent. Illnesses fell 26.1 percent to 109,400, now fewer than in 2019, with respiratory illness cases down 67.6 percent.
The two rates under the headline. 842,500 cases involved days away from work, a rate of 0.8 per 100 full-time equivalent workers. Another 558,300 involved days of job transfer or restriction, a rate of 0.5. Those are the cases that cost you a schedule, not just a log entry.
Health care and social assistance remains the largest sector. It recorded 535,500 cases, down 3.3 percent from 553,800, at a rate of 3.2 per 100 full-time equivalent workers, down from 3.4 and still well above the 2.3 private-industry figure. Retail trade followed with 319,600 cases, down 5.9 percent, and manufacturing with 304,200, down 8.5 percent.
Three sectors went the other way. Total cases in educational services rose 13.5 percent to 42,000. Couriers and messengers rose 11.4 percent to 75,200, driven by job transfer or restriction cases, which were up 47.5 percent to 29,500. Real estate and rental and leasing rose to 41,400 cases, its rate moving from 1.6 to 2.0. If you carry safety for a school district or a campus, the OSHA standards that reach education employers are the place to start.
Warehousing stayed close to where it was. 72,800 cases, down 5.5 percent, with an injury rate of 4.4 per 100 full-time equivalent workers, down from 4.6 and still double the 2.2 private-industry injury rate.
One caution before you compare. For the 2025 estimates, BLS moved the survey from the 2017 to the 2022 North American Industry Classification System. That update caused minor revisions in five industries and major revisions in retail trade and information, and BLS says comparisons with earlier industry data should be made with caution. Every change quoted above is one BLS reports as statistically significant at the 95-percent confidence level.
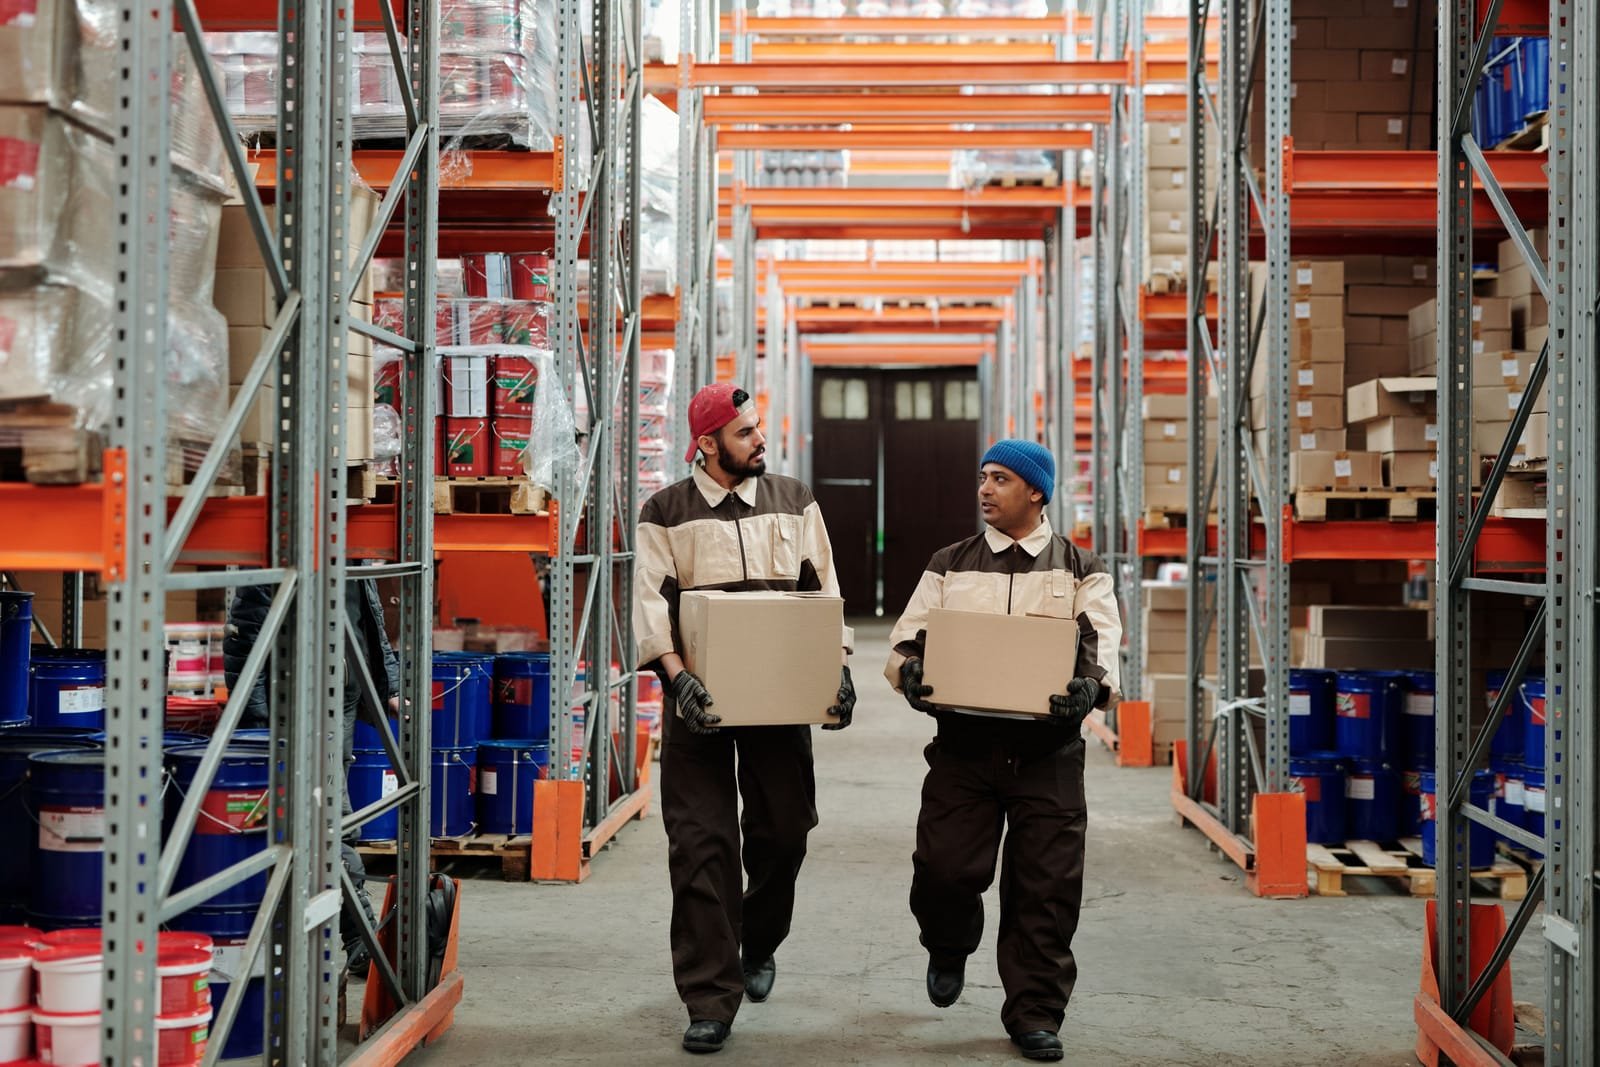 Two warehouse workers in work jackets and gloves carrying cardboard boxes down an aisle between tall pallet racks loaded with drums and cartons. Photo: Tiger Lily, via Pexels (Pexels License)
How to compute your own rate before February 1
1. Close the log before you count it. 29 CFR 1904.32(a) requires you, at the end of each calendar year, to review the OSHA 300 Log to verify the entries are complete and accurate, correct any deficiencies, create the annual summary, certify it and post it. A rate computed from a log nobody reviewed is a number you cannot defend.
2. Pull the two figures the 300A already asks for. Paragraph (b)(2)(ii) requires the annual average number of employees covered by the OSHA 300 Log and the total hours worked by all employees covered by it. That hours figure is your denominator, and payroll usually already holds it. Our OSHA recordkeeping guide covers what belongs on the log before you total the columns.
3. Do the arithmetic. BLS publishes the formula in How To Compute Your Firm's Incidence Rate for Safety Management: the number of injuries and illnesses multiplied by 200,000, divided by employee hours worked. The 200,000 stands for 100 employees working 40 hours a week, 50 weeks a year, and that is what makes your result comparable to the 2.3 above.
4. Keep paid non-work time out of the hours. BLS is explicit that hours worked should not include nonwork time even though paid, such as vacation, sick leave and holidays. Where actual hours are not available, for employees paid by commission, salary or mileage, it allows an estimate based on scheduled hours or 8 hours per workday.
5. Compute DART as well as the total. The DART rate covers cases with days away from work, or job transfer or restriction, or both, which BLS takes as Column H plus Column I of the summary, run through the same formula. The total rate says how often. DART says how hard.
6. Compare against your industry, not the country. BLS notes a rate means more when a firm's experience is set beside other employers doing similar work with workforces of a similar size. 2.3 is everyone. 3.2 is health care and social assistance. 4.4 is warehousing injuries.
7. Then finish the calendar. A company executive certifies the summary under 1904.32(b)(3). It goes up no later than February 1 and stays up until April 30 under (b)(6). And if your establishment had 250 or more employees, or 20 to 249 in an industry listed in appendix A, 29 CFR 1904.41 requires the 300A information to reach OSHA electronically by March 2.
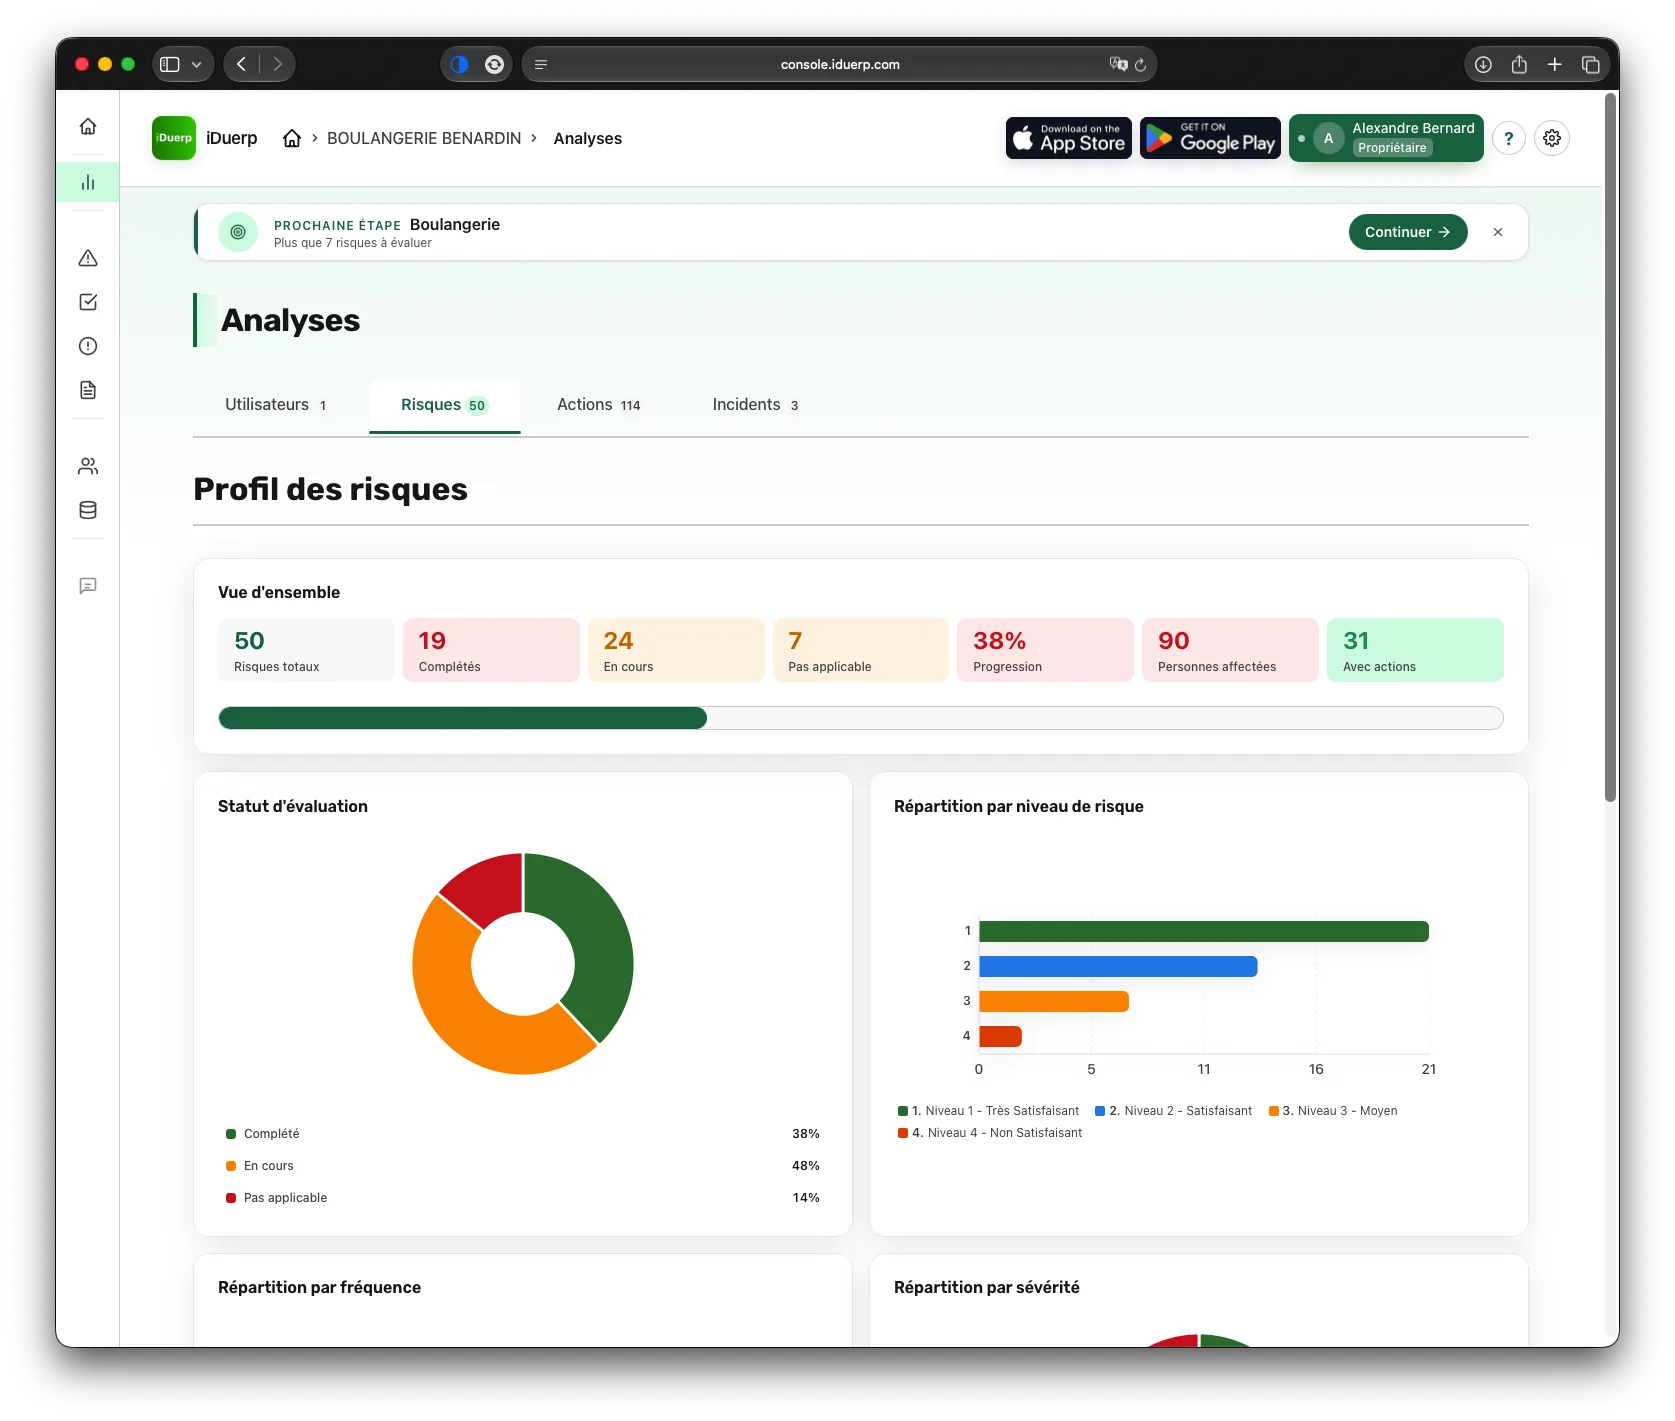 OSHAid console: the analytics dashboard, where recorded incidents are totalled over the year instead of being counted again each January
A rate you can stand behind
A rate on its own is a claim. What makes it credible is everything underneath it: entries dated and classified as they happened, hours worked that match payroll, corrective actions closed against the cases that moved the number, the training that followed.
That is what a prequalification packet, an insurer at renewal and a board slide are all actually asking for. The rate is the headline; the evidence behind it is what gets believed.
Keep the log, the actions and the records in one place through the year, and in January your rate is a report you run rather than a reconstruction you dread.
Questions safety officers ask
- What was the average OSHA incident rate in 2025?
BLS reported a total recordable case rate of 2.3 cases per 100 full-time equivalent workers across private industry in 2025, from 2.4 million cases. Health care and social assistance came in at 3.2, and warehousing and storage had an injury rate of 4.4.
- How do I calculate my OSHA incident rate?
- Where do I find the hours worked for the calculation?
Related reading
All posts- Nov 21, 2026Temporary worker safety training: who gives it, who proves itCase study
- Nov 20, 2026Rubber insulating glove testing requirements: the six-month clockOSHA update
- Nov 18, 2026OSHA abatement certification: the step that closes a citationCitations
- Nov 13, 2026OSHA whistleblower complaint: the hearing rules change on December 9Rule change
About this article
Written by the OSHAid Safety Desk from official sources (OSHA news releases, the text of the standards, BLS and NIOSH data), checked against those sources and reviewed before publication. It explains what a rule says; it is not legal advice for your situation. OSHAid
Reach February 1 with a log you can total
Create a free OSHAid account: record incidents as they happen, keep corrective actions and training records beside them, and arrive at the annual summary with figures you can certify. No commitment.
Try OSHAidFreeDownload on theApp StoreGET IT ONGoogle PlayThe intelligent OSHA companion that automates your field compliance. Mobile app + web console + specialized safety AI agent, built for US workplaces.
ProductIndustriesGuides- OSHA compliance software
- Hazard assessment guide
- Safety program templates
- JHA examples
- OSHA requirements
- OSHA recordkeeping
- OSHA standards by industry
- Workplace hazards
- Get started
- What is OSHA?
- Workplace safety glossary
- Why OSHAid?
- Enterprise solutions
- About
- Blog
- Legal notice
© 2026 OSHAid - published by DUOPP (SAS). All rights reserved.
Help us improve OSHAid
We only measure site traffic. No advertising, no resale of data.
OKDeclineLearn more